Automated Characterization of Phospholipid Fatty Acids in Soil Samples using MIDI Sherlock
The Field
The soil microbiota is responsible for many ecosystem functions such as plant growth regulation, nutrient cycling and carbon sequestration. Additionally, the microbiota has the ability to degrade environmental pollutants, such as PAHs and PCBs.
Phospholipids are an essential structural component of all microbial cellular membranes. Upon microbial death, phospholipids rapidly degrade. Phospholipid content in a soil sample is therefore assumed to be from the living microbiota. Phospholipid fatty acids (PLFAs) are the main structural component of the phospholipid and serve as useful biomarkers for different microbial groups. PLFA analysis is a widely-used technique for estimation of the total biomass and to observe broad changes in the soil microbiota composition. Either Gas Chromatography (GC) or Gas Chromatography-Mass Spectroscopy (GC-MS) may be used to determine PLFA profiles.
The Challenge
The manual approach to analyzing a soil chromatogram requires a highly-skilled analyst to identify each peak, typically involving twenty or more different PLFAs. Once the peaks of interest are found, their absolute sizes need to be determined, by scaling to an internal standard included in the extract.
Due to the large number of compounds, the usual approach is to combine PLFAs by types and their relationship to the microbes that create those fatty acids. Branched chain fatty acids, for example, are predominantly made by Gram-positive bacteria, while 10-methyl fatty acids are made by actinomycetes. Grouping results in this manner gives a sense of the microbial community in the soil and allows comparison before and after treatment. But the process is tedious and error-prone.
Once you have acquired a chromatogram from a soil sample, there has always been a lot of work needed to interpret the data and tease-out the information that it contains, fortunately, now, a software solution exists that can automates these processes saving the analyst time and assuring accuracy. The package is MIDI, Inc.’s Sherlock™ software and it is available from Anatune.
Compound Naming
A PLFA chromatogram from a soil sample contains a series of peaks, each specific to a particular fatty acid. Each peak elutes at a different retention time and is measured in intensity by the area of the peak. Sherlock uses the retention time information in a unique manner: based on a multiple-compound calibration standard run with each batch of samples, Sherlock determines the Equivalent Carbon Length (ECL) for each peak. For saturated fatty acids ECL is the number of carbons. For instance, 16:0, the saturated 16 carbon fatty acid has ECL 16.0000. Compounds that fall in between the saturated fatty acids are given interpolated values. 18:1 ω9c, the 18 carbon fatty acid with a double bond in the ninth position, has ECL 18.3628. Because Sherlock uses information from the calibration standard run with each batch, ECL computation is a precise measure for each compound that accommodates instrument variation. In this manner, a broad variety of PLFAs can be automatically identified.
Sherlock may also be used with GC-MS, in which case the spectral information is combined with the ECL information for confirmation of the compound naming.
Advanced Calculations
Having named the fatty acids, the Sherlock system can immediately report the relative percent of each fatty acid based on the relative area response from the GC. If an internal standard is included, Sherlock scales these results to absolute values, in nanograms per gram soil or nanomoles per gram soil, as desired.
Categorization software is included which can sum PLFAs by type of microbe that produces them. As Gram-positive bacteria produce branch chain fatty acids, so instead of listing the individual branch chain fatty acids such as 15:0 iso, 15:0 anteiso, 17:0 iso, and 17:0 anteiso each with their amounts, a sum can be presented showing the total amount of fatty acids from Gram-positive bacteria. Similar results can be given for Gram-negative bacteria, arbuscular mycorrhizal fungi, actinomycetes, and so on.
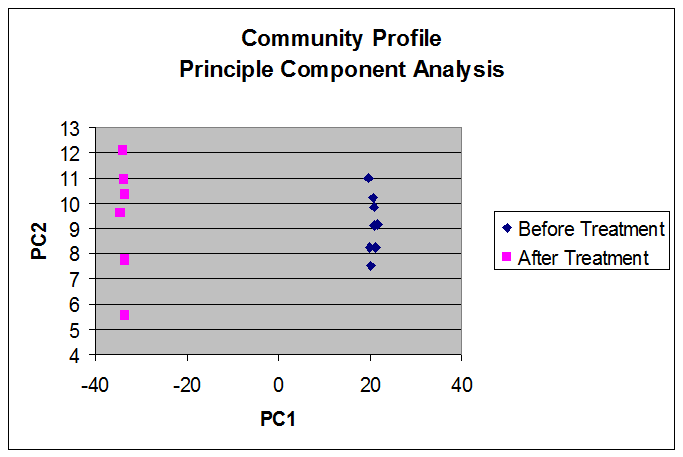
These results can be presented as a cross-tabulation to ease discernment of patterns in the data, or visualized as Principle Component Analysis plots or Dendrograms.

Summary
Sherlock automates compound naming of phospholipid fatty acids in soil, saving time, eliminating tedium and reducing errors. Sherlock can calculate absolute amounts of PLFAs, categorize fatty acids by microbial type, and provide visual as well as tabulated results.
Automation using Sherlock assures a complete and objective analysis of PLFAs in soils.
Anatune can build automation solutions for GC and GC-MS sample preparation based upon instrumentation from Agilent Technologies and GERSTEL. The addition of the Sherlock software provides for the first truly end-to-end solution for the analysis of Soil Phospholipids.
If you would like to know more call us on +44 (0)1223 279210 or email enquiries@anatune.co.uk.
Previous post
Identifying Aldehydes, Ketones via Automated DesorptionNext post
Your GC Column Matters!
