

Using Chemometrics to Unlock Hidden Information in Your Data
We can now generate fantastically rich data sets from the latest high-resolution mass spectrometers such as the Agilent 7200 GC/Q-TOF. However, to take full advantage of the opportunities that these large and complex data sets can provide, the analyst needs equally good software that is both flexible and intuitive. One great solution is to combine the power of the 7200 with the data mining and Chemometrics capabilities of Agilent GeneSpring software.
“Chemometrics” is a collective term usually involving the use of Multivariate Analysis (MVA) techniques extract “meaning” from mass spectrometry data. It’s particularly central in Metabolomics workflows, for which the 7200 GC/Q-TOF has many uses.
Labs often put a lot of effort into deciding what is the right instrument for them, but often the subsequent handling of the data is something that receives rather less attention. In fact there are many immediate benefits by adopting Chemometric workflows.
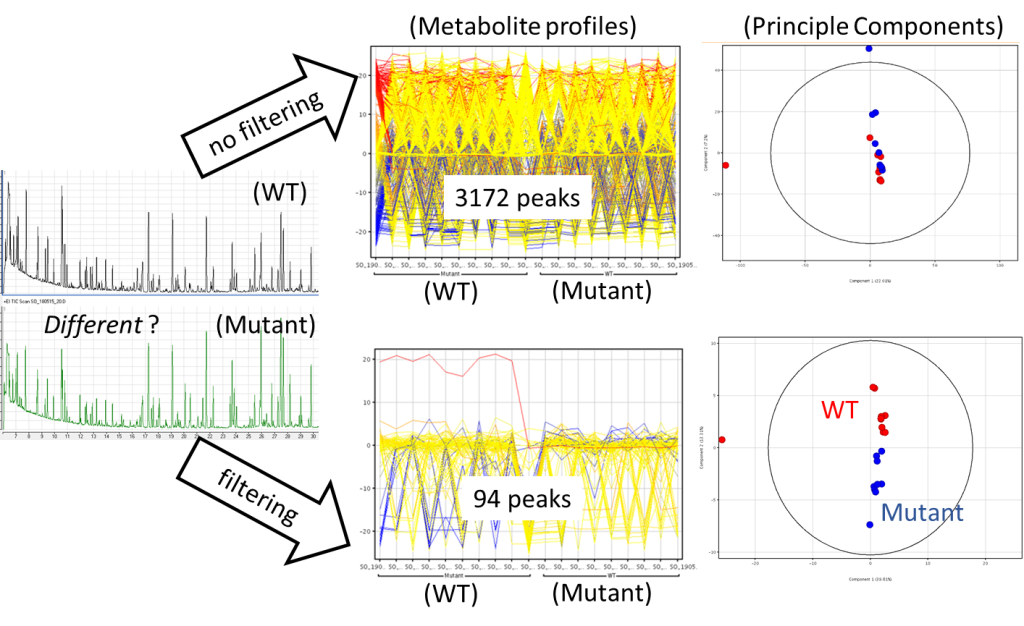
For example, figure 1 shows data gathered using the 7200 GC/Q-TOF from a set of plants, Arabidopsis, wild-type (WT) verses Amino Acid Biosynthesis Mutant.
Metabolites were analysed as their tert-butyldimethylsilyl (tBDMS) derivatives by derivatization of freeze-dried plant tissue with MTBSTA. GC-MS analysis was done using a DB-5ms column.
From the chromatograms alone, it’s difficult to tell any differences. When we import the deconvoluted peak data into GeneSpring and plot the metabolite profiles, there is still too much information; without data filtering 3172 potential peaks are seen. GeneSpring has powerful workflows allowing us to filter our data. In this example we take only those peaks found to be present in every sample replicate for either the WT or Mutant, leaving 92 peaks. You can also see that another advantage of data filtering is that by only including the most consistently present peaks now when Principle Components are plotted, we see a clear difference between the WT and the Mutant, this difference was obscured when using the unfiltered data.
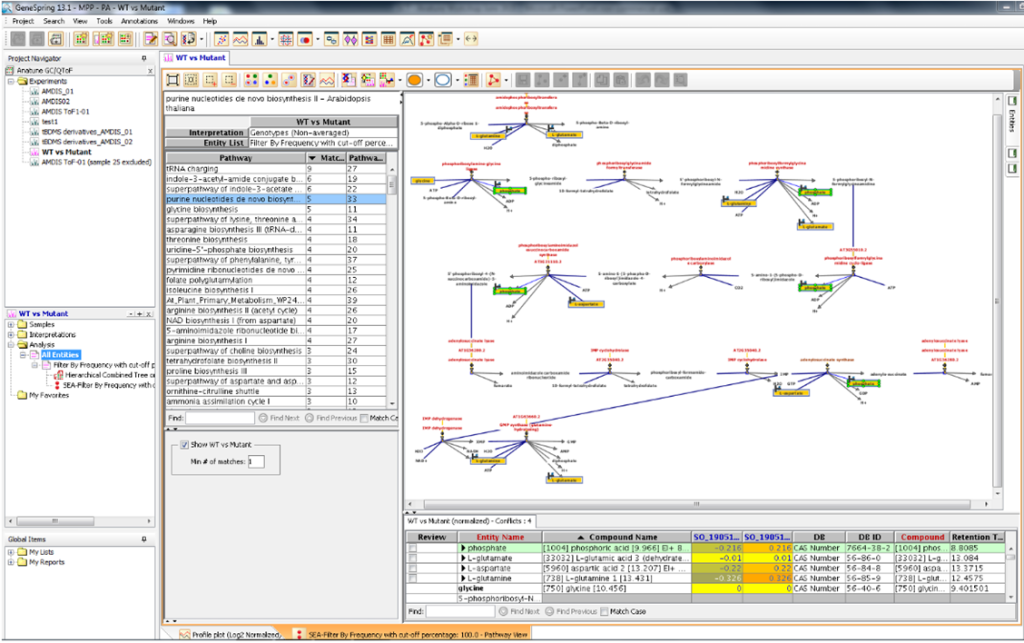
Once you’ve got your data into GeneSpring there are many other powerful things you can then do, such as mapping identified metabolite peaks directly to biological pathways (fig.2) or build predictive calibration models. You can also use data from simple GC-Quads (including AMDIS files). The uniquely integrated workflows provided in GeneSpring greatly increase the speed and efficiency of turning just “data” in “knowledge”.
Looking at data in this way is very powerful, but getting started can be tough. I have a great deal of experience in this area and it is my business to help analysts make good use of chemometrics. If you want to have a chat about this in relation to your work, please give me a call or drop me an email.
Dr Simon C Thain (TL Science LTD) provides consultancy and training services for mass spectrometry informatics, Metabolomics, Chemometrics and Biomarker discovery. Contact: simon.thain@thainlab.co.uk; tel: (+44) (0)7801438719.